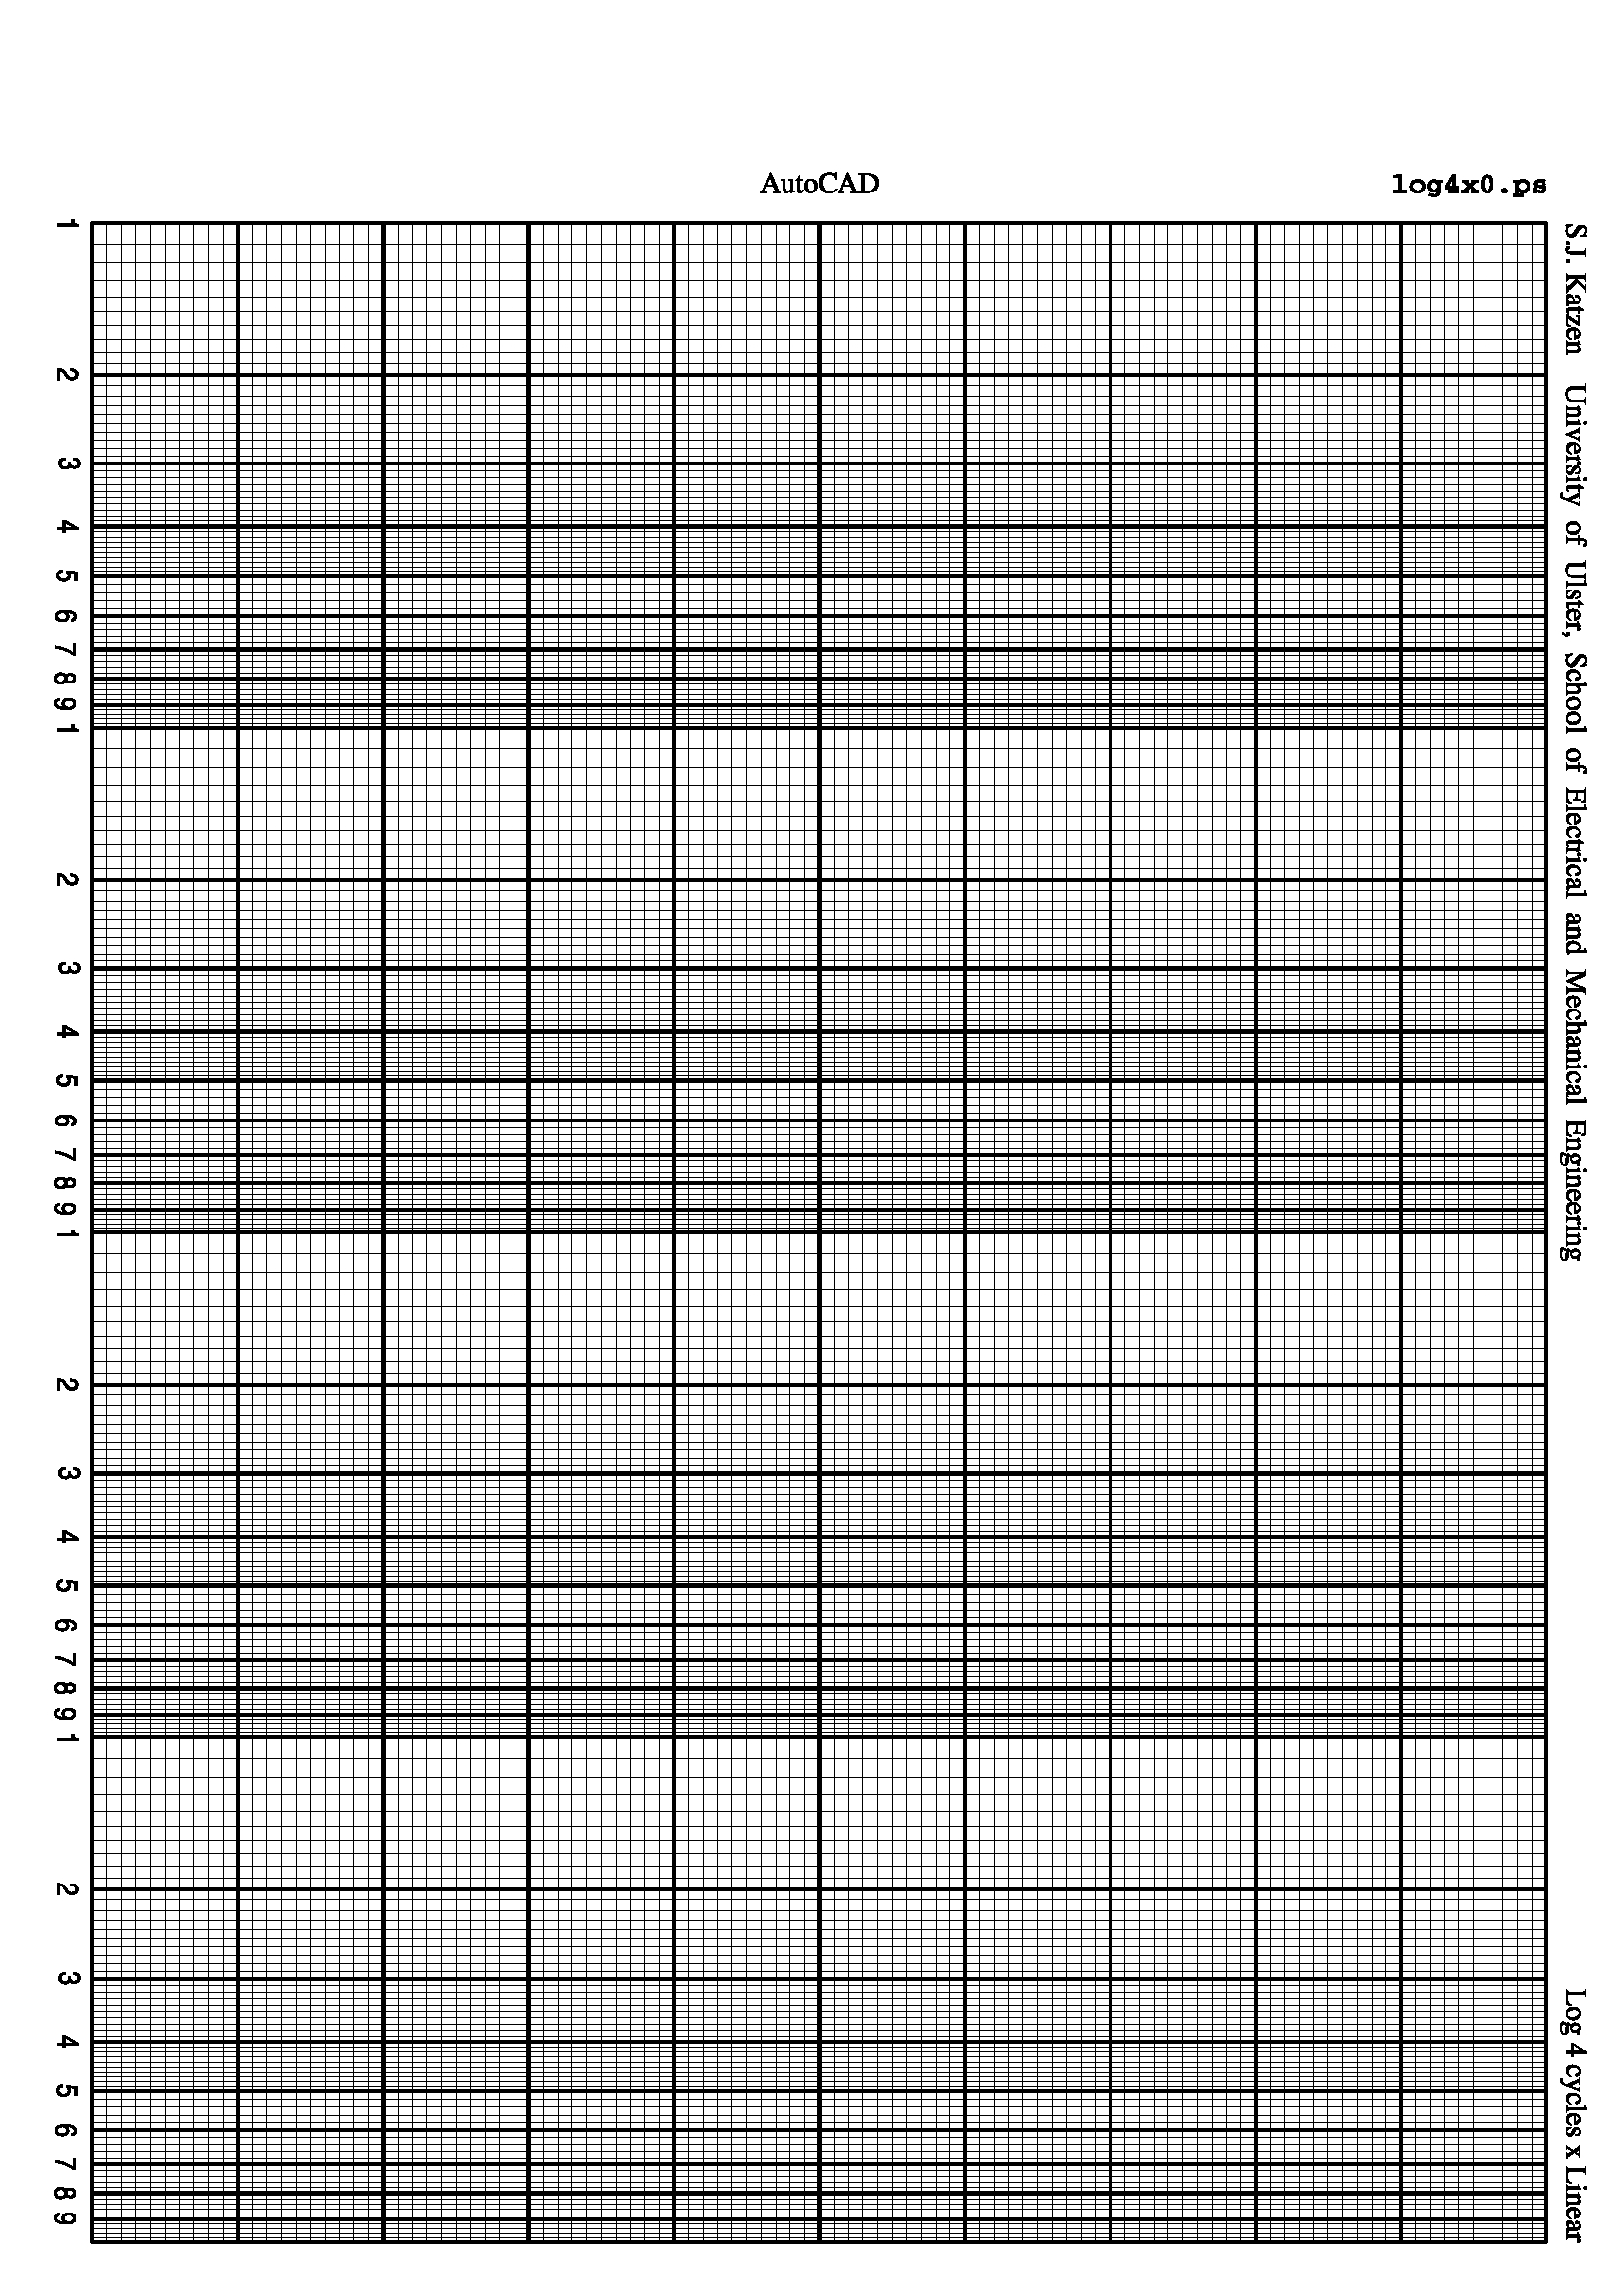
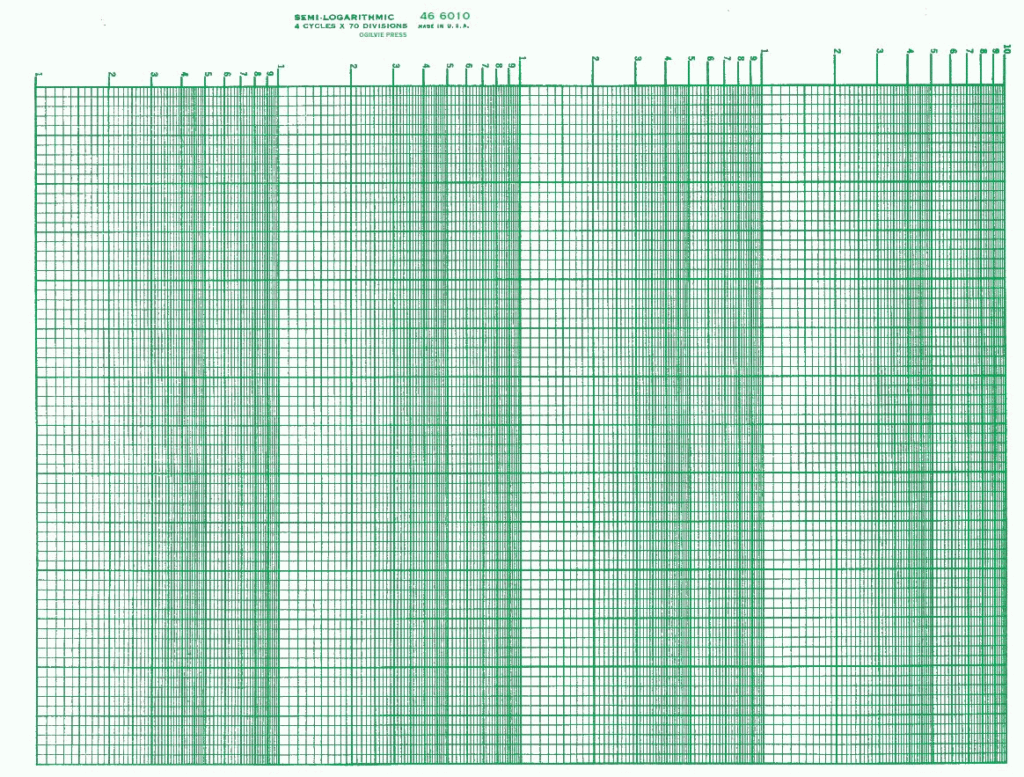
4 cycle semi log graph paper is a valuable tool for anyone working with data that spans a wide range of values. This type of graph paper features a logarithmic scale on one axis and a linear scale on the other, allowing for accurate representation of data that covers several orders of magnitude. The semi log format is particularly useful for plotting data that exhibits exponential growth or decay, such as population growth or radioactive decay.
Printable 4 cycle semi log graph paper is convenient for those who prefer to work with physical copies rather than digital tools. By printing out graph paper with the desired number of cycles and grid spacing, users can easily create custom graphs for their specific data sets. This can be especially useful for students, scientists, engineers, and anyone else who needs to visualize data in a clear and organized manner.
How to Use 4 Cycle Semi Log Graph Paper
To use 4 cycle semi log graph paper effectively, start by determining the range of values you need to plot on each axis. The logarithmic scale should cover the full range of your data’s exponential growth or decay, while the linear scale can be adjusted to best fit your data points. Use a different color or style of line for each data set to differentiate them on the graph.
When plotting data on 4 cycle semi log graph paper, remember that equal distances along the logarithmic scale represent equal ratios of values, rather than equal differences. This can be a helpful way to visualize trends in data that span multiple orders of magnitude. Be sure to label your axes clearly and include a title that describes the purpose of the graph.

